10. Indicators
An Indicator, in a nutshell, is a mathematically simple operation on a specific field of each document, that in the end produces a numeric result. The operation could be a count, summation, subtraction, division and so on. It could also be a check if a value is available in a field, if it is above a threshold, or if it is unique, or if its division with another number gives a desired result.
Formally, an Indicator is a function that takes in a dataset as an argument and returns a single number.
This essentially means that the Indicator is also applied to the dataset. The dataset here can be practically anything, from the whole dataset (the set of documents that the search query returned) to any subdataset.
What can a subdataset be?
a node in a graph (a collection of documents with a common property, e.g. associated to the same affiliation, or to the same country)
an edge in a graph (a collection of documents with two common properties, e.g. associated to the same two affiliations, or to the same two countries)
a data point in a time-series plot.
Indicators are used everywhere throughout TIM, in one form or another.
The simplest example is in the standard Organisations page that is available by default:
The size of each subdataset/node (=organisation) signifies the number of documents affiliated with the organisation.
This number is calculated by simply applying a count indicator to each node.
By applying a different indicator on the node, the size of the node could signify a different quantity, for example how active an organisation is, or what is the total cost of EU projects spent by a country per year.
Important
Each Indicator needs a dedicated Custom Page utilizing it in order to display it.
Inside the Custom Page settings, there is a choice to apply the indicator on the node (nIndicator) or on the edge (eIndicator), or on both.
The Indicators available are split into the following categories.
10.1. Common
10.1.1. Count
The Count indicator returns the number of documents with any value in the specified field. If no field is specified, it just counts the number of documents available. With a field specified, a max/min cardinality (size) limit can be imposed on the field, i.e. if a field in the document has more than MAX or less than MIN values, the document will be ignored in the counting.
So, creating a Count Indicator with emm_affiliation__ename as the field and specifying min_cardinality=3 will count the number of documents for each subdataset that contain at least three affiliations, e.g. a publication with at least three authors.
Example
For the above case, let’s say we apply the Indicator to nodes that represent countries, e.g. in a page based on the Location>Countries page.
Each country/node here is a subdataset.
Let’s say one of the nodes, Germany, has 80 publications in total, and only five of them have more than 3 authors - the rest of them all have a single author.
When the Indicator is applied to the Germany node, it will go through each publication and will consider only these five nodes.
In the end, the size of Germany will be 5.
Let’s say now that we wanted to see how much of a “team-player” a country is when it comes to international collaborations.
We could apply the same Indicator to a location>Countries-type page again, but this time specifying emm_affiliation__country as the specified field in the indicator, and setting min_cardinality=2.
This would then show Countries with collaborations on an international level, not just different authors.
We could go an extra step and create one more duplicate Countries page, with another indicator with max_cardinality=1 this time.
This would show solo players, and we would be able to compare the two pages to each other.
10.1.2. Distinct
The Distinct indicator, when applied to a subdataset, returns the number of distinct (non-identical) values of a specified field inside the documents of the (sub)dataset.
Example
Let’s say we are viewing a location>Countries page, so each node is a country.
Each country, thus, is a subdataset.
We create a distinct Indicator with emm_author as the specified field.
- Node1: Germany
doc1 authors: A, B, Cdoc2 authors: A, Cdoc3 authors: DThe distinct indicator will return 4.
- Node2: Italy
doc1 authors: E, F, Gdoc2 authors: E, Gdoc3 authors: E, Fdoc4 authors: GThe distinct indicator will return 3.
10.2. Time
10.2.1. Activeness
The Activeness indicator returns the number of documents of a subdataset in a specific time range, divided by the total number of documents of the subdataset. Thus, highly active nodes (organisations, countries etc) in that time range will get a score closer to 1 and highly inactive nodes will get a score closer to 0.
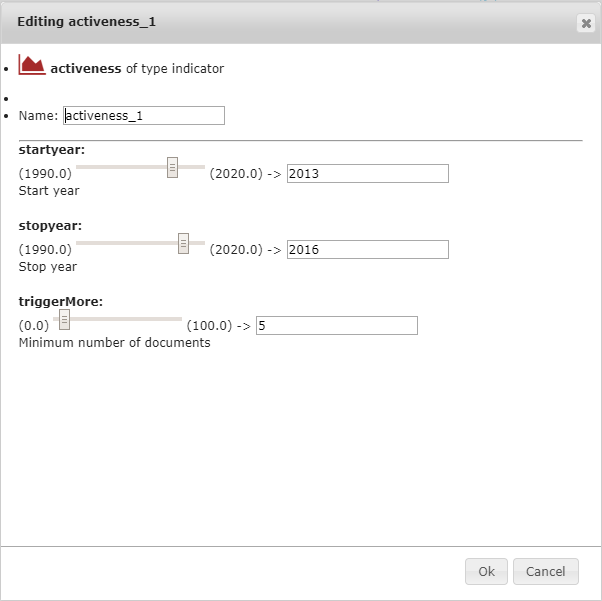
10.2.1.1. startyear
The beginning of the time range in which documents are going to be counted.
10.2.1.2. stopyear
The ending of the time range in which documents are going to be counted.
10.2.1.3. triggerMore
The subdataset total document number threshold below which the activeness Indicator gives a zero result.
Example
We compare three organisations’ Activeness indicator for the years 2015-2017, with a triggerMore threshold of 20 documents.
Nr. of documents
2013
2014
2015
2016
2017
Last 3 years
Total
Organisation A
2
1
1
5
4
10
13
Organisation B
2
1
4
7
12
23
26
Organisation C
6
6
6
3
2
11
23
Organisation A node:
The total number of documents is: 13, which is below the selected triggerMore value. The activeness Indicator will then return 0 for this node.
organisation B node:
The total number of documents is 26, which is above the given triggerMore value. The activeness Indicator will then return (4 + 7 + 12)/26 = 0.88: the node is more active lately.
organisation C node:
The total number of documents is 23, which is also above the given triggerMore value. The activeness Indicator will then return (6 + 3 + 2)/26 = 0.42: the node is not as active as it used to be.
10.2.2. peak
The peak indicator returns the number of documents delta (maximum peak) of a subdataset for the selected time range.
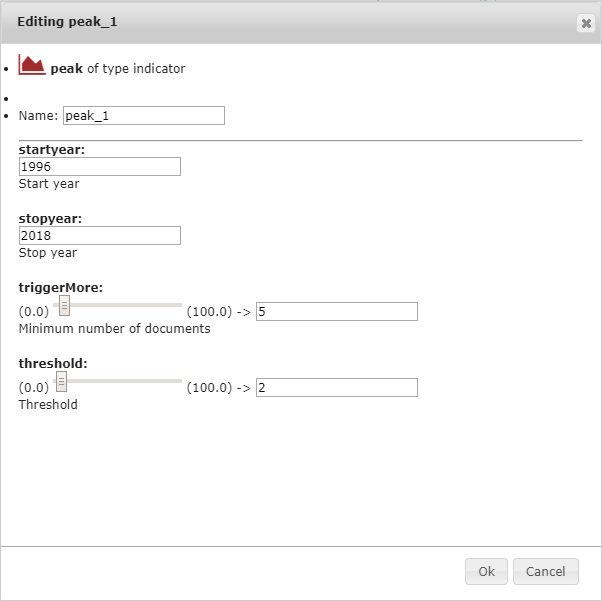
10.2.2.1. startyear
The beginning of the time range in which documents are going to be counted.
10.2.2.2. stopyear
The ending of the time range in which documents are going to be counted.
10.2.2.3. triggerMore
The subdataset total document number threshold below which the activeness Indicator gives a zero result.
Example
if an entity has a large peak, say 50 documents from one year to the next, but the total number of its documents is 55, and the triggerMore option is set to 60, the indicator will return a zero value.
10.2.2.4. threshold
The lowest number of documents for a delta to be considered.
Example
For the previous example, if threshold is additionally set to 20, the indicator for all entities with biggest peak lower than 20 documents will be a zero value.
10.2.3. peakyear
The peakyear indicator is the same indicator as the peak indicator, but instead returns the year where the maximum peak of the subdataset occured.
10.2.4. newness
10.3. Number
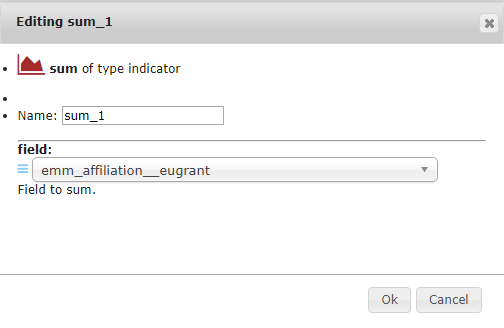
10.3.1. sum
The sum indicator takes a field as its argument, and sums its numeric values for the whole (sub)dataset.
Example
We want to sum the total project expenditure of the EU on countries.
We select emm_affiliation__eugrant as field in the indicator settings above.
We then go on to create a Custom Page, select emm_affiliation__country in the field to group option and then select this new Indicator in the nIndicator field.
Important
The quality of this kind of Indicator depends on the availability of data provided by the respective sources. Please be aware that some values like the cost in the above example might be available for a fraction of the projects available.
10.3.2. min
The min indicator returns the minimum of all the values in the selected field in the (sub)dataset.
10.3.3. max
The max indicator returns the maximum of all the values in the selected field in the (sub)dataset.
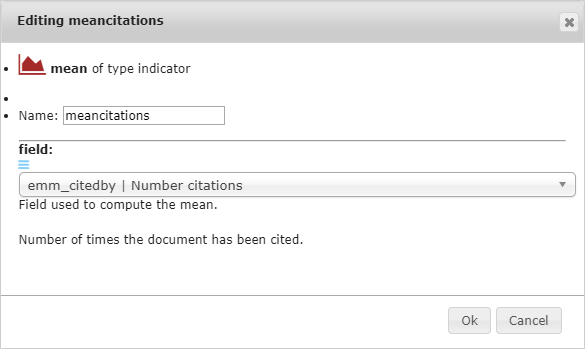
10.3.4. mean
The mean indicator returns the average of all the values in the selected field in the (sub)dataset.
Example
We want to see the average number of normalized citations for each author.
We select emm_citedbyn as field in the indicator settings above.
We then go on to create a Custom Page, select emm_author__name in the field to group option and then select this new Indicator in the nIndicator field.
The same indicator could also be used e.g. for a emm_affiliation__ename or an emm_affiliation__ecountry Custom Page.
10.3.5. hindex
This is an author-level metric that attempts to measure both the productivity and citation impact of the publications of a scientist or scholar. For more information on what the h-index is, see e.g. the relevant Wikipedia article.
This Indicator should be displayed in a Custom Page that uses the field emm_author__name.
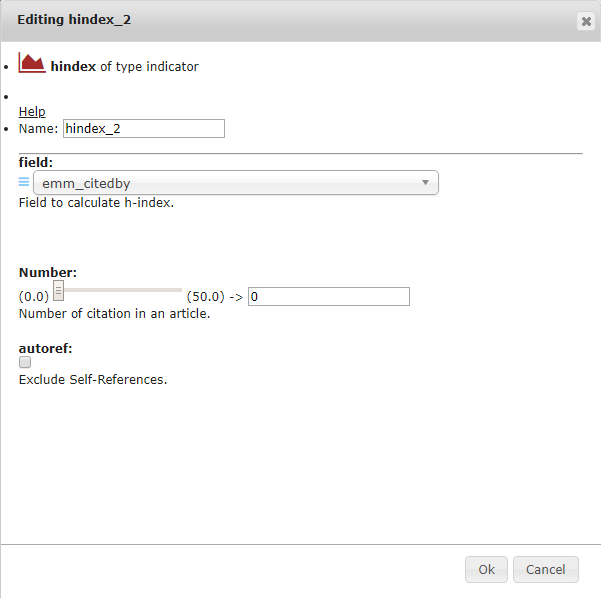
10.3.5.1. field
Here, the field to calculate the h-index should be selected.
This field can only be emm_citedby.
10.3.5.2. Number
This is the number of citations in an article to consider.
10.3.5.3. autoref
This exclude references of the author to their works.
10.4. Field
10.4.1. Coverage
The coverage indicator takes a field and a value as its arguments, counts all the documents that contain the value of that field at least once, and returns the ratio of the number of these documents over the total number of documents.
Example
Let’s say we have 4 documents and we want to find what is the percentage of documents that contain at least one EU organisation. We apply a coverage indicator with field: emm_affiliation__eeucountry and value: “EU”.
doc1 emm_affiliation__eeucountry: EU, US, Australia
doc2 emm_affiliation__eeucountry: EU, EU, Japan
doc3 emm_affiliation__eeucountry: China
doc4 emm_affiliation__eeucountry: S. Korea, S. Korea
The coverage indicator is going to return (1+1+0+0) /4 = 0.5
This essentially tells us what percentage of research is (co-)developed by the EU member states.