13. Computed Columns (DRAFT)
Computed Columns provide TIM with added functionality in a complementary way: they add extra columns of information to each subdataset. The result of this is best visualised when exporting the data from TIM into Excel tables: the Computed Columns are indeed added to the exported data as extra columns. In the same way, when creating custom pages that have a list format, the list can be extended to be a full table, by including Computed Columns. But one can also benefit from Computed Columns indirectly in graphs, where the information stored in a Computed Column can be visualised by manipulating the color coding of the nodes.
13.1. Computed Columns example
13.1.1. Top10 Orgs per country
Let’s say we want to extract the top 10 organisations for specific countries in a big dataset.
13.1.1.1. How to use Computed Columns in TIM
Define the computed column
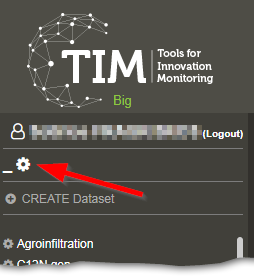
Go to the space configuration page and select Computed Column.

Here, select Common>Top>Create, you’ll be redirected to the options for this Computed Column.

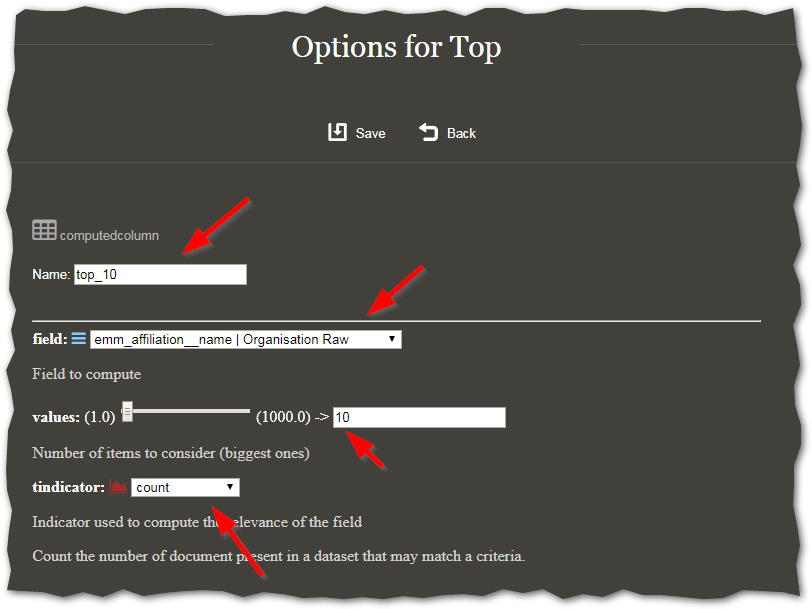
Choose a name for the computed column, preferably something meaningful using the default prefix, in this case top_10.
The field to be chosen is the one we want to compute the values for.
In this case, select emm_affiliation__name|Organisation Raw.
We then choose the number of items to consider (here, the value should be 10).
Finally we need to choose an indicator.
In this case, we want to select the top 10 organisations in volume of documents, so we will just choose tindicator: count.
This operation computes the top 10 Organisations (Raw) in number of documents.
Visualise the result of the computed column
We need to choose which field we are going to use to group the data (i.e. what are we calculating the top10 out of). Here we want to obtain the top 10 organisations per country, so the grouping field will be Country (Raw).
Go back to the space configuration page, and now select Custom Page.
In Category Miscellaneous, choose to create a Gram.
In this case, the gram will be called gram_top10.
As field, we choose our “grouping” field (Country Raw). The number of values should be large enough to cover all the possible values of that field.
In the suboption Computed Column, we choose the computation we previously prepared.
The rest of the options can be left at their default values.